Chainlink’s Biggest Holders Are Quietly Repositioning – Binance Data Reveals Why

Chainlink is trading below $10 as the market faces a critical test around support levels that have held through weeks of sideways price action without delivering the breakout bulls have been waiting for. The price is under pressure — but top analyst Darkfost has identified a signal in the exchange flow data that suggests the current weakness may be obscuring a development that the price chart is not yet reflecting.
The context Darkfost establishes first is the broader market environment that makes the Chainlink signal worth isolating. Since the local bottom recorded in early February, the crypto market has shown early signs of recovery. Total3, which measures the combined market capitalization of all cryptocurrencies excluding Bitcoin, Ethereum, and stablecoins, has increased by more than 15% over that period. The recovery exists, but it has been deeply uneven.

Some assets have dramatically outperformed the baseline. HYPE has surged nearly 190% since the February lows — a move that reflects a specific combination of genuine utility growth, ETF momentum, and institutional accumulation that most altcoins have not been able to replicate. The broader altcoin market has recovered modestly while a handful of assets have generated cycle-defining returns.
In that kind of selective environment, Darkfost argues that flow data becomes the most useful tool available for identifying where genuine investor interest is shifting before it becomes visible in price. And in that data, Chainlink is beginning to send a signal worth paying close attention to.
The Biggest Chainlink Withdrawals Since 2025
Darkfost’s Chainlink signal is specific and documented. The top 10 outflow transactions on Binance — the largest daily withdrawals by transaction size — have increased sharply in recent weeks, reaching their highest level since 2025. Throughout May, the largest daily outflows averaged more than 3,600 LINK, with several individual sessions recording spikes above 5,000 LINK withdrawn in a single day.

LINK Top 10 Whale outflow | Source: CryptoQuant
These are not routine portfolio adjustments. They are the behavioral signature of participants making deliberate, large-scale decisions to move Chainlink off the exchange and into external storage.
The price context is what makes the outflow data significant rather than simply notable. These record withdrawals are occurring while LINK is still trading approximately 66% below its previous cycle highs. The participants driving the largest outflows are not accumulating into strength or chasing a recovery that has already run. They are building positions at deeply discounted levels — a behavioral profile consistent with long-term conviction rather than short-term momentum trading.
Darkfost is careful about what a single indicator can and cannot confirm. Large outflows accelerating do not guarantee a structural reversal — on-chain signals require corroboration before they become actionable conclusions. What the current Chainlink outflow data does suggest is that a portion of the market has made a quiet, deliberate decision about where the asset is heading from here — and has begun repositioning accordingly, well before the price has given any public confirmation that the thesis is correct.
LINK Continues Grinding Near Support
Chainlink remains trapped in a prolonged consolidation structure below the psychological $10 level, with price continuing to trade inside a tight range that has defined most of the market since February. The daily chart shows LINK struggling to establish sustained momentum despite repeated attempts to reclaim higher resistance zones near $10.50 and $11.
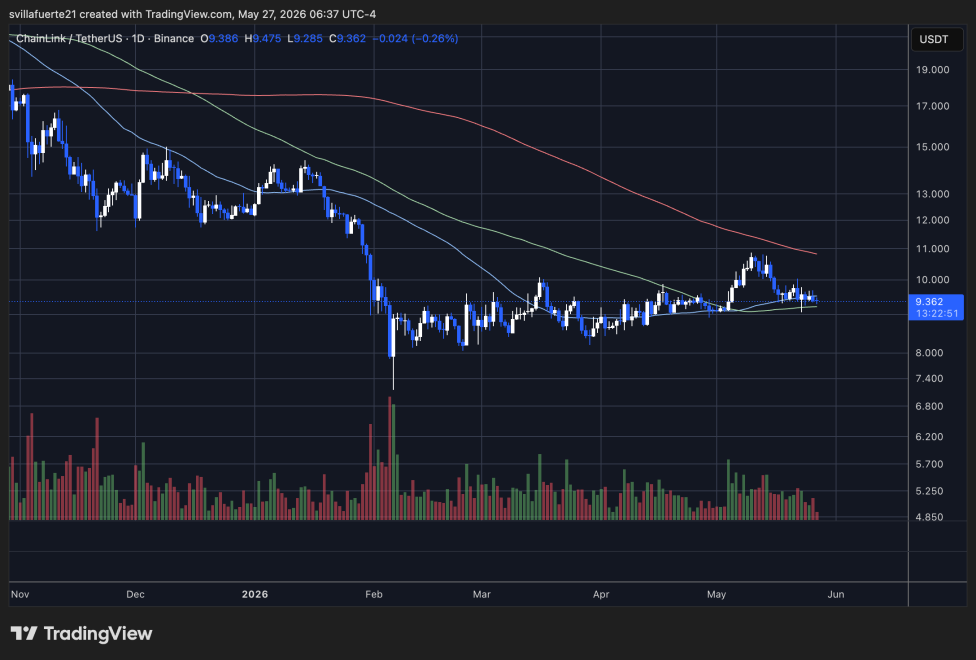
Chainlink consolidates below $10 mark | Source: LINKUSDT chart on TradingView
Technically, the structure remains fragile but stable. LINK is currently trading around the convergence area of the short-term moving averages, reflecting the indecision that has dominated recent price action. The 50-day moving average has flattened after months of decline, while the 100-day and 200-day averages continue trending downward overhead, showing that the broader macro trend has not yet fully reversed bullish.
At the same time, the chart also highlights an important shift in behavior compared to the aggressive selling phase seen earlier this year. Since the sharp breakdown in February, LINK has consistently formed higher lows around the $8.50–$9 support region, suggesting that buyers continue absorbing sell pressure whenever price approaches that area.
As long as LINK holds above the $8.50–$9 range, the broader accumulation structure remains intact despite the lack of immediate upside expansion.
Featured image from ChatGPT, chart from TradingView.com

Editorial Process for bitcoinist is centered on delivering thoroughly researched, accurate, and unbiased content. We uphold strict sourcing standards, and each page undergoes diligent review by our team of top technology experts and seasoned editors. This process ensures the integrity, relevance, and value of our content for our readers.